author image

When your audience faces two choices, how do you bring instant clarity? The comparison slide in PowerPoint is your answer. This guide delivers the simple steps to build powerful visual comparisons using tables, charts, and ready-made comparison ppt templates.

Comparison slides in PowerPoint is a simple way to show how two or more things are different or the same. It helps your audience understand choices easily. They are commonly used to compare products, plans, ideas, results, or features.

Types of PowerPoint Comparison Slides

  • Side-by-Side Text: You just put two blocks of text next to each other. This is simple for a basic ppt comparison slide.
  • Comparison Table: A table lists features in rows. Different items show their values in columns.
  • Comparison Chart: This uses shapes, bars, or lines to show numbers. A powerpoint comparison chart is good for data.

Use WorkPPT AI to Create a Comparison Slide

A fast way to get a PowerPoint comparison slide is by using AI tools. Tools like WorkPPT AI PPT can help. You just type what you want to compare. The tool will then quickly make a basic comparison slide PowerPoint for you.

screenshot of workppt ai powerpoint

Steps to create comparison slides in minutes:
1. Enter your comparison content or upload your document.
2. Review the AI outline and make changes if needed.
3. Choose a comparison slide template you like.
4. Customize(insert chart or table) and finish your slide.
5. Export the result as PPTX.

⭐⭐⭐⭐⭐ Rated 4.8 by 1.3M Users

Make a Comparison Slide in PowerPoint Manually

If you want to build the slide manually, PowerPoint offers different ways to show comparisons. You can use a basic slide layout, a table, or a chart.

Make a Comparison Layout in PowerPoint

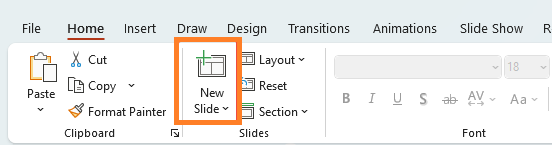
1. Open PowerPoint and add a new slide.

add new slide to create comparision ppt slide
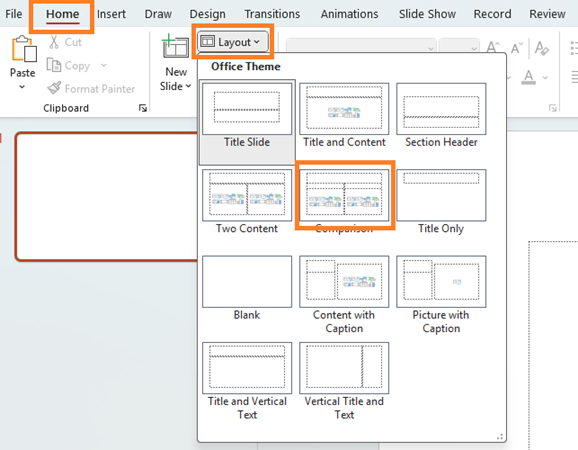
2. Go to Home > Layout and choose Comparison layout.

workppt presentation outline

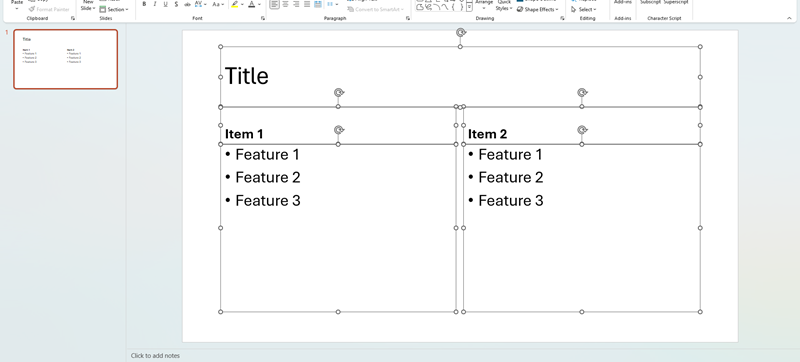
3. Replace the placeholder text with your own content.

fill content to powerpoint comparison slide
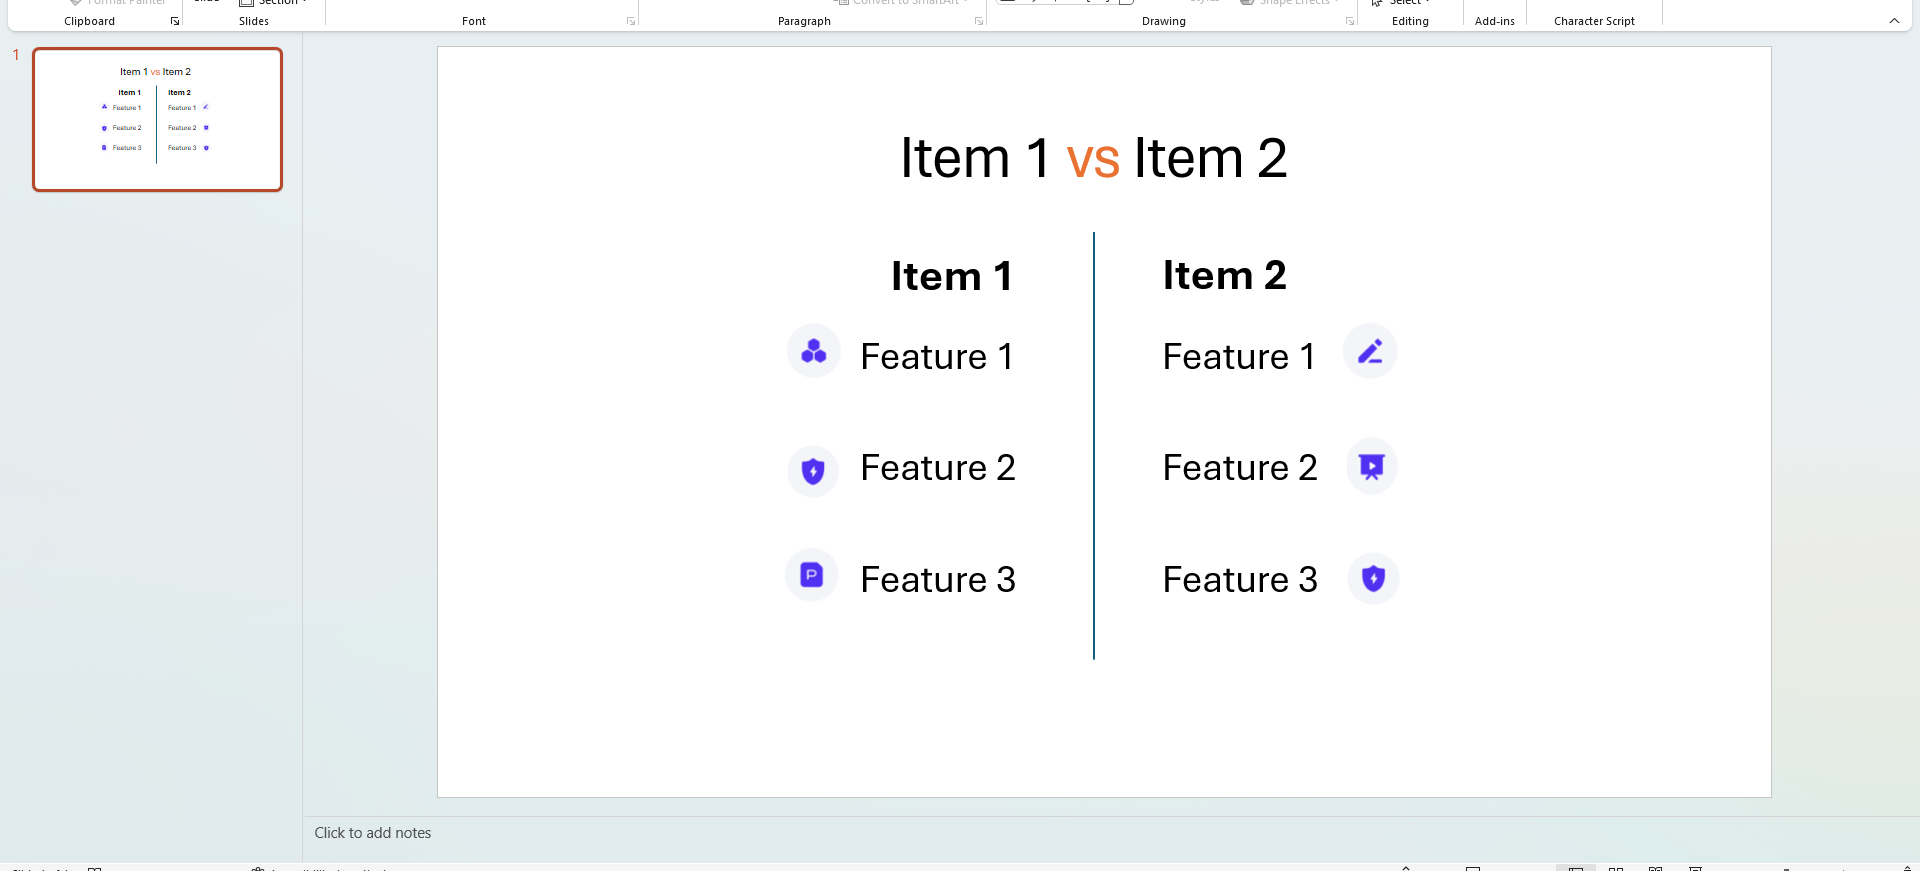
4. Add icons or shapes to make the slide clearer.

adjust comparison powerpoint slide

How to Add a PPT Comparison Table

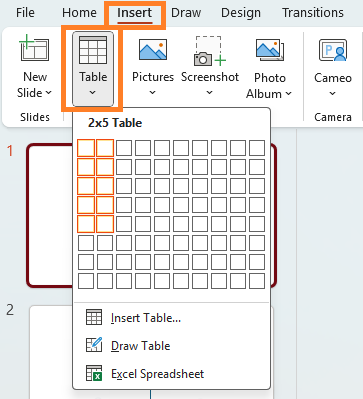
1. Insert a new slide(Shortcut key:Crtl+Shift+M).

add new slide to create comparision ppt slide
2. Go to Insert > Table and choose the number of rows and columns.

add ppt comparison table

3. Enter your content and data.

fill in ppt comparison table

4. Use Table Design and Table Layput to beautify the table:

    • Change table colors and styles
    • Modify borders and border weight
    • Change text alignment inside cells
    • Add or remove gridlines

beautify in ppt comparison table

How to Create Powerpoint Comparison Chart

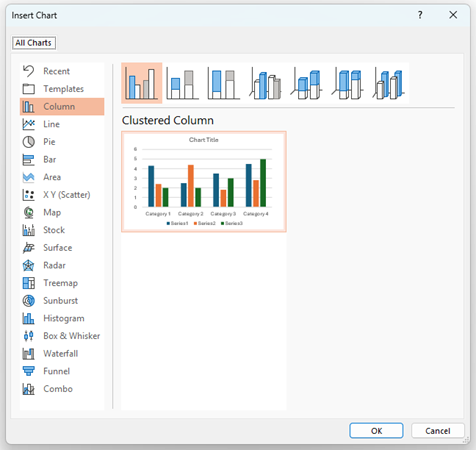
1. Go to Insert > Chart.

insert powerpoint comparison chart

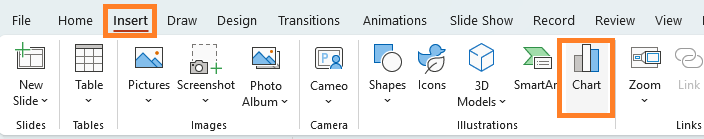
2. Select a bar chart, column chart, or line chart.

select powerpoint comparison chart

3. Enter your data in the Excel window. And close the Excel window when done.

edit powerpoint comparison chart

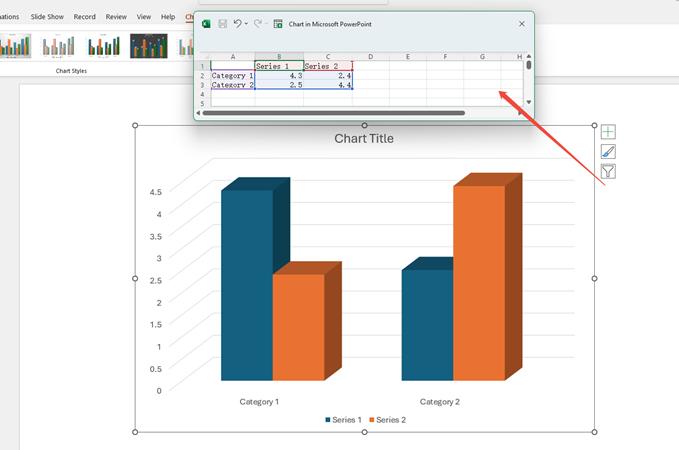
4. Use Chart Design to update colors and labels.

design powerpoint comparison chart

PowerPoint Comparison Slide Templates

You can download comparison templates from many websites. Here are some good options:
1. Slidesgo – Free and modern templates.
2. SlideModel – Professional business templates.
3. Canva– Easy drag-and-drop designs.
4. PresentationGO – Free editable comparison layouts.
5. GraphicRiver– Premium templates with clean styles.

Design Tips for Better Comparison Slides

To make your slide compare look good and work well, follow these tips:

  • Use a clean layout.
  • Keep both sides balanced and aligned.
  • Use short text instead of long paragraphs.
  • Add icons to show key points.
  • Use two different colors to show differences clearly.
  • Avoid too much information on one slide.
  • Highlight the most important element.

FAQs about Comparison Slide PowerPoint

Q: What is the best format for a comparison slide?

A: The best format depends on your needs.

  • Use a side-by-side layout when you want a quick, clear A vs B comparison.
  • Use a table when you need to compare many features or more detailed information.
  • Use a chart when you want to compare numbers or show differences visually.

Q: How many points should I include on a comparison slide?

A: Keep it short. Three to five points for each item is enough.

Q: Can I compare more than two items?

A: Yes, but keep the layout neat. A table may work better for three or more items.

Q: Can I use AI to make comparison slides?

A: Yes. You can give your comparison information to an AI tool, such as WorkPPT, and it will automatically create a clean and well-structured comparison slide for you.

Q: Where can I find free templates for comparison slides?

A: PowerPoint includes basic themes and layouts you can use for comparison slides. But if you want more polished or unique designs, you can visit websites that offer PowerPoint templates. Search for “comparison,” “compare,” or “vs” templates. Some templates are free, but many high-quality ones may require payment.

💬 Conclusion:

By following these easy steps and design tips, your comparison slide PowerPoint will help your audience make choices easily every time. If you want a faster option, AI tools like WorkPPT can create a clean comparison slide for you in seconds.

Make Your Slide Instantly