
Whether you’re preparing a business or a research report, sometimes you need a simple way to show how data overlap. Venn diagrams are perfect for this. They use overlapping circles to make complex data easy to understand at a glance.
This guide will walk you through about how to create a Venn diagram in Google Slides, step by step. We’ll also share quick tips to make your slides faster and easier.
- What is Venn Diagram in Google Slides
- Components of a Venn Diagram
- How to Create a Venn Diagram in Google Slides
- How to Insert a Venn Diagram in Google Slides
- Effortlessly Create PPT with AI Tools - WorkPPT
- FAQs about Creating Venn Diagram
- Q: How many sets can a Venn diagram include?
- Q: What if the Diagram tool in Google Slides doesn't have a Venn option?
- Q: How do I ensure colors and transparency of different circles in a Venn diagram coordinate well?
- Q: Can I add animation effects to a Venn diagram?
- Q: Can Google Slides import Venn diagrams from PowerPoint?
What is Venn Diagram in Google Slides
A Venn diagram uses overlapping circles to show how different sets are connected. Each circle represents a set, and the overlaps highlight shared elements. In presentations, Venn diagrams are often used to:
- Compare product or service features.
- Show overlapping roles or responsibilities.
- Explain categories or concepts.
- Organize ideas and brainstorm.
In Google Slides, Venn diagrams are easy to edit, can be customized with color and text, and work well alongside other graphics.
Components of a Venn Diagram
Before we begin creating, let’s first understand the core components of a Venn diagram:
Element | Function | Tips |
Circle | Each circle represents a set or concept | Size and color can be freely adjusted |
Intersection | The overlapping area shows shared features | Set opacity to 50%-70% so overlaps are easy to see |
Label | Text to describe each set or overlap | Keep labels short and clear for readability |
Auxiliary Line/Arrow (Optional) | Highlights relationships or flows | Use the “Insert → Shapes/Lines/Arrows” for added clarity |
Now that we understand the components of a Venn diagram, we can proceed to create one directly.

Design Smarter with WorkPPT AI
Tired of spending hours designing your Google Slides? Try WorkPPT for free today and transform plain slides into eye-catching presentations!
How to Create a Venn Diagram in Google Slides
Google Slides gives two ways to make a Venn diagram: using the built-in Diagram tool or drawing shapes manually. Here are the detailed steps:
Method 1: Use the Diagram Tool
This is the simplest and fastest method, ideal for beginners.
Step 1: Open Google Slides and start a new presentation or open an existing one.
Step 2: Select “Insert > Diagram > Relationship” in the top menu. And a panel will appear on the right.
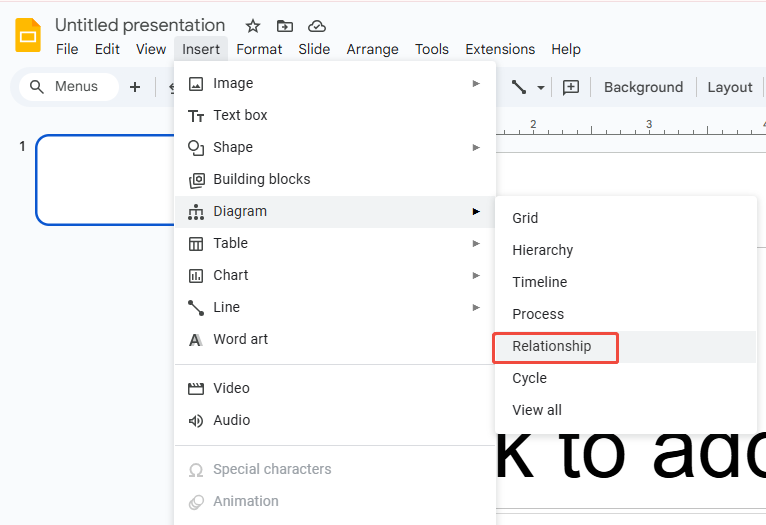
Step 3: On the right panel, pick the number of circles and select a Venn diagram template.
Step 4: Select each circle to change text, color, size, or position.
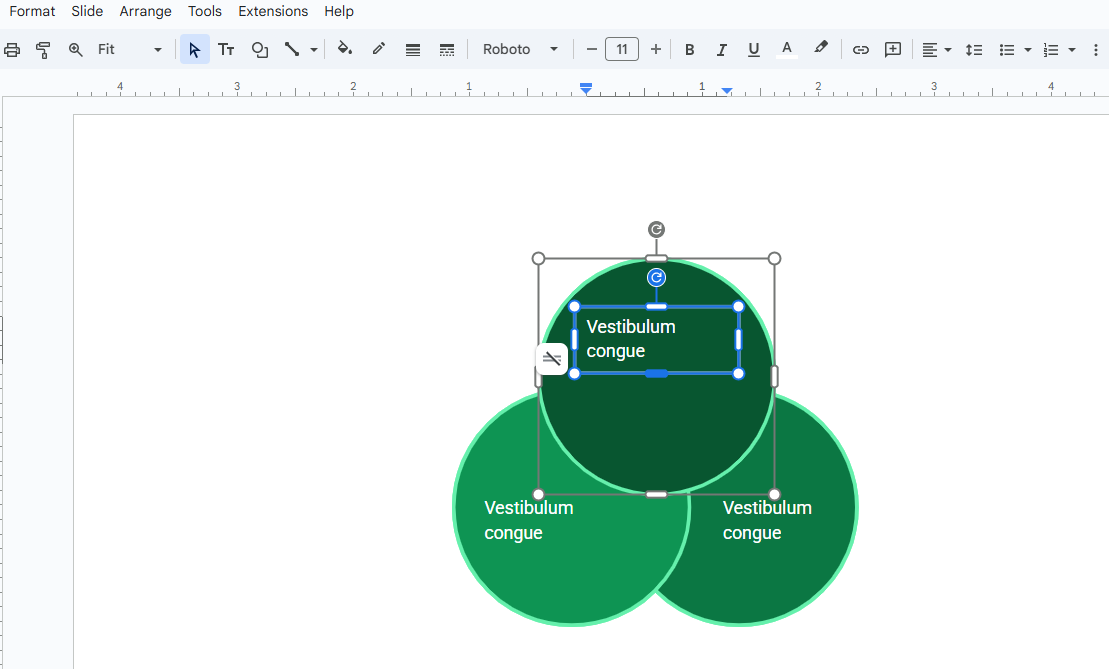
Step 5: Adjust transparency to highlight overlapping areas, completing the diagram’s customization and creation.
This method of how to make a Venn diagram on google slides works well for 2–3 sets. If you want more control over colors, sizes, or shapes, the manual method is better.
✍ [You May Also Like]: How to Change Shape Color in Google Slides
Method 2: Use Google Slides Shapes
If you want complete control over the Venn diagram’s style, you can manually create it using Shapes. Follow these steps:
Step 1: Open Google Slides, select “Insert > Shapes > Oval”.
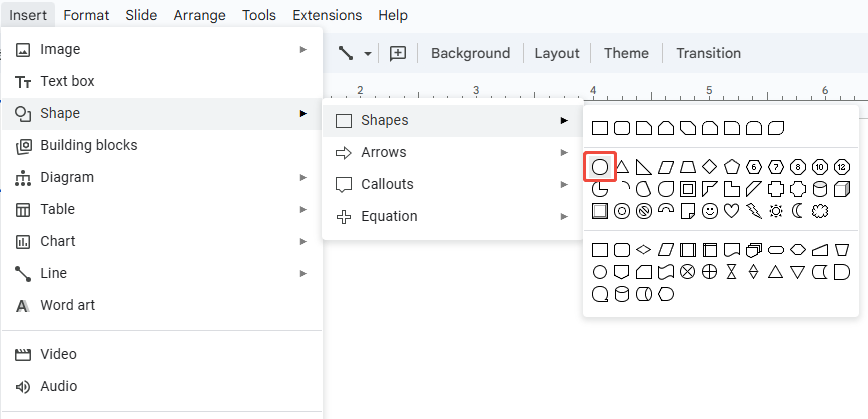
Step 2: Hold down the “Shift” key to draw a perfect circle.
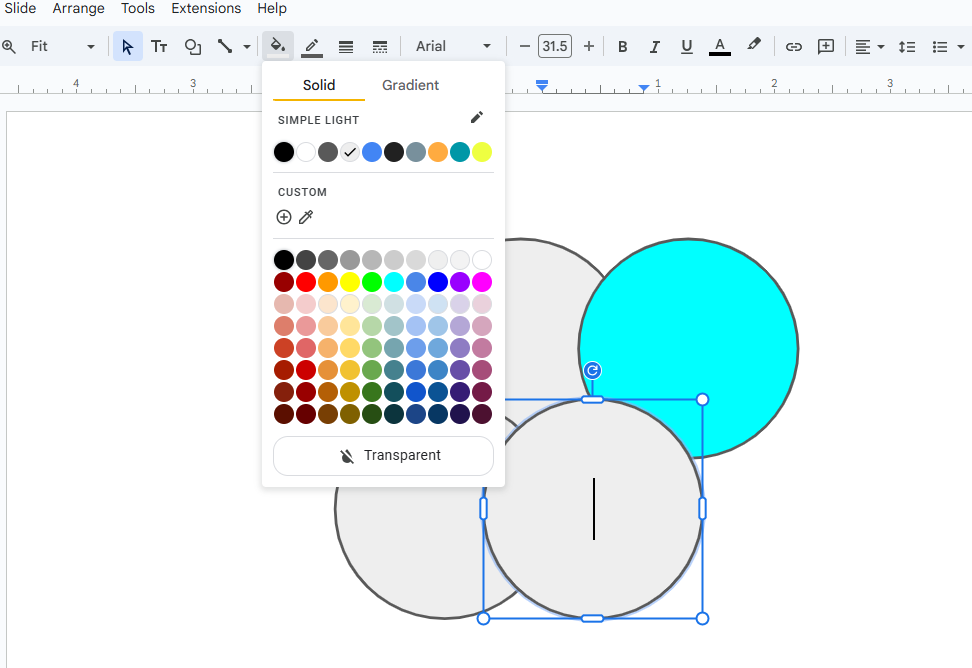
Step 3: Copy and paste the circles, then resize and position them so they overlap correctly.
Step 4: Apply fill colors and adjust transparency levels.
Step 5: Insert text boxes to add labels inside the circles or overlapping areas.
Finally, add arrows or auxiliary lines to indicate logical relationships, completing your Venn diagram.
Using Shapes gives you unlimited sets and colors, and lets you fully customize your diagram, perfect if you care about look and style.
How to Insert a Venn Diagram in Google Slides
If you’ve already created a Venn diagram in PowerPoint, Excel, or an online generator, you can insert it directly into Google Slides:
Step 1: Export the Venn diagram as a PNG or SVG file.
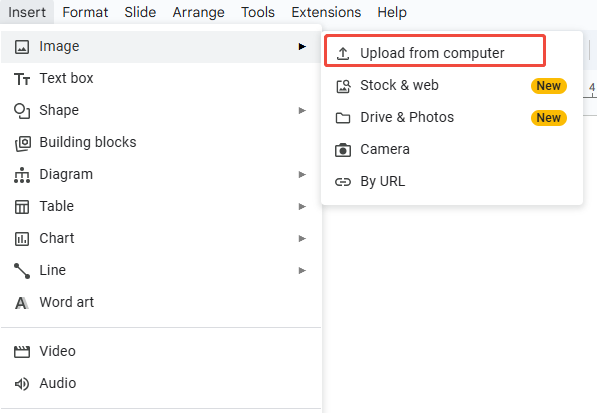
Step 2: Open Google Slides, then select “Insert > Image > Upload from computer”.
Step 3: Right-click the image to group or resize it as needed.
SVG files are especially useful because they maintain quality when scaled, making your slides look professional even on large screens.
Effortlessly Create PPT with AI Tools - WorkPPT
If you’re tired of endlessly creating Google Slides, give WorkPPT AI PPT Maker a try. It’s a great helper for crafting presentations, transforming your simple ideas into polished slides quickly and easily, helping you create professional slides without the hassle. Plus, it boosts productivity with a smooth all-in-one office experience.
💡 Key Features:
- Transform simple topics into a full slide deck in just 3 minutes.
- AI handles layouts, images, and content structure automatically.
- Offers ready-to-use templates for business, education, market analysis, and more.
- Integrates AI PDF, AI Mind Map, and other tools for smarter office work.
- Export easily to Google Slides or PowerPoint.
FAQs about Creating Venn Diagram
Q: How many sets can a Venn diagram include?
A: In theory, there’s no strict limit. However, more than 4–5 sets can make the diagram cluttered and confusing. For clarity, it’s usually best to stick to 3–4 sets.
Q: What if the Diagram tool in Google Slides doesn't have a Venn option?
A: Check your Google Slides version or manually draw using Shapes.
Q: How do I ensure colors and transparency of different circles in a Venn diagram coordinate well?
A: Use similar color palettes and maintain transparency between 50%-70% for optimal visibility without causing eye strain in overlapping areas.
Q: Can I add animation effects to a Venn diagram?
A: Yes. Access animation effects like fade-in or zoom via Menu → Insert → Animation Settings.
Q: Can Google Slides import Venn diagrams from PowerPoint?
A: Yes, but note that layout adjustments may be required.
💬 Conclusion:
Venn diagrams are a simple way to show how things relate, compare data, and analyze logic. With this guide on how to create a Venn diagram in Google Slides, you can quickly make clear, attractive Venn diagrams in Google Slides. They’re great for teaching, reports, or business presentations, helping your audience understand complex relationships instantly.