
There are three main ways to create a Gantt chart in PowerPoint. Each has its pros and cons, so you can pick the one that fits your needs best.
Method 1: Creating a Gantt Chart Using Bar Charts
The first method involves creating a Gantt chart from scratch using a bar chart, which allows for precise time visualization and easy updates.
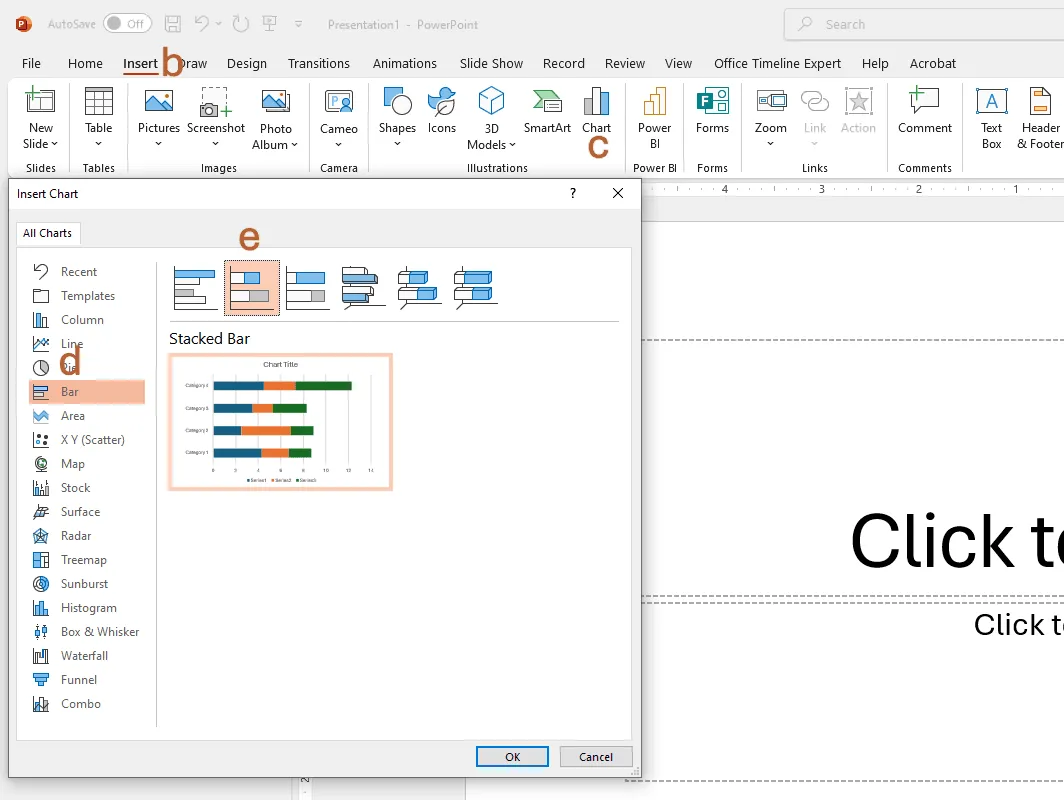
Step 1: Open PowerPoint, click “Insert” > “Charts” > “Bar Charts”. Select the “Stacked Bar”, as it works best for building a Gantt chart.
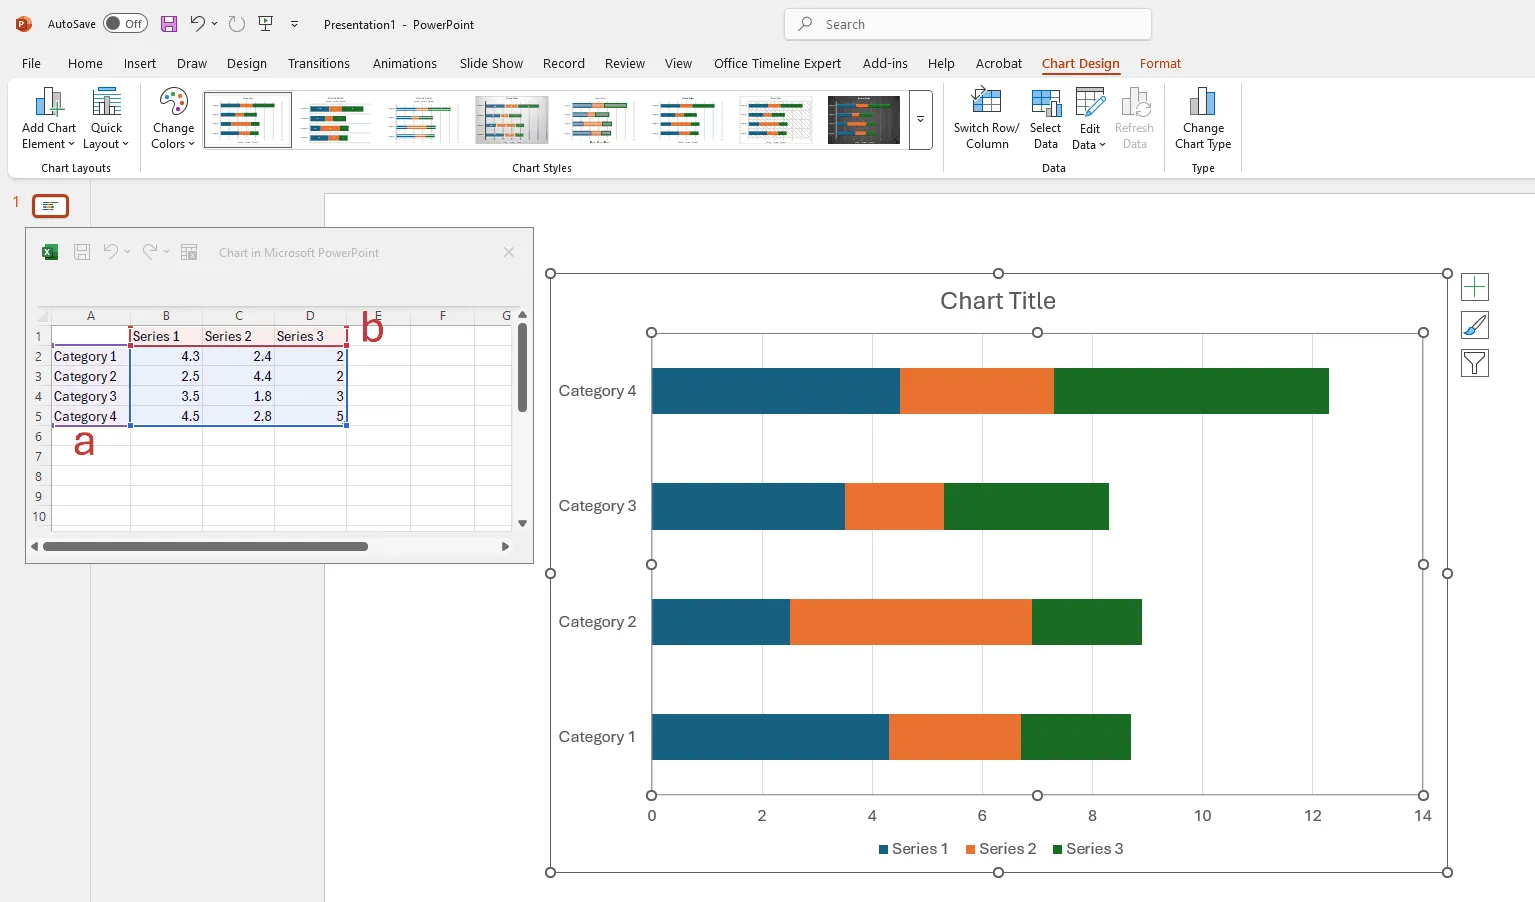
Step 2: PowerPoint will display a small Excel data table. Replace the sample data with your own, setting “Start Date, End Date, and Duration”. Each row represents a task.
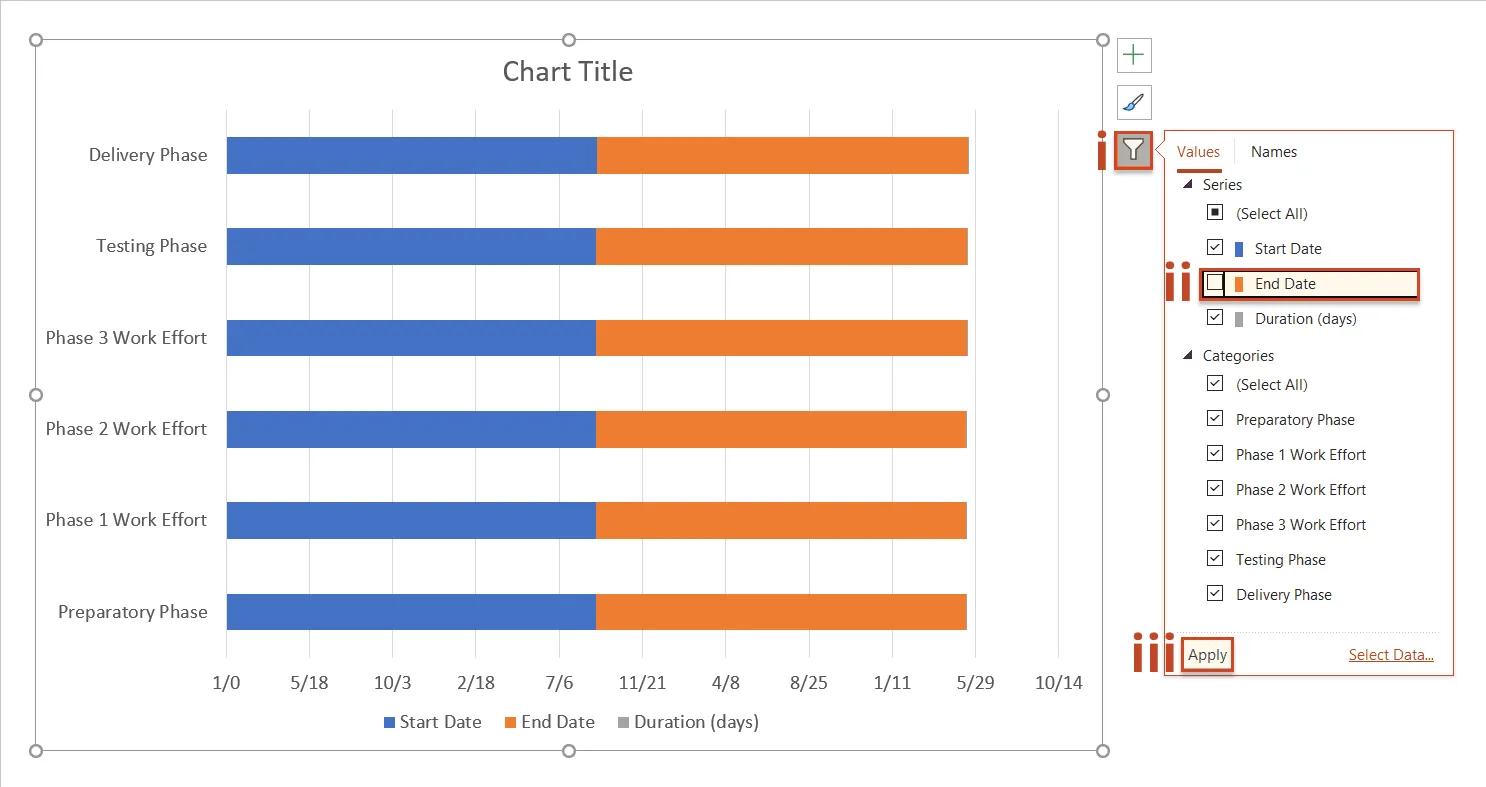
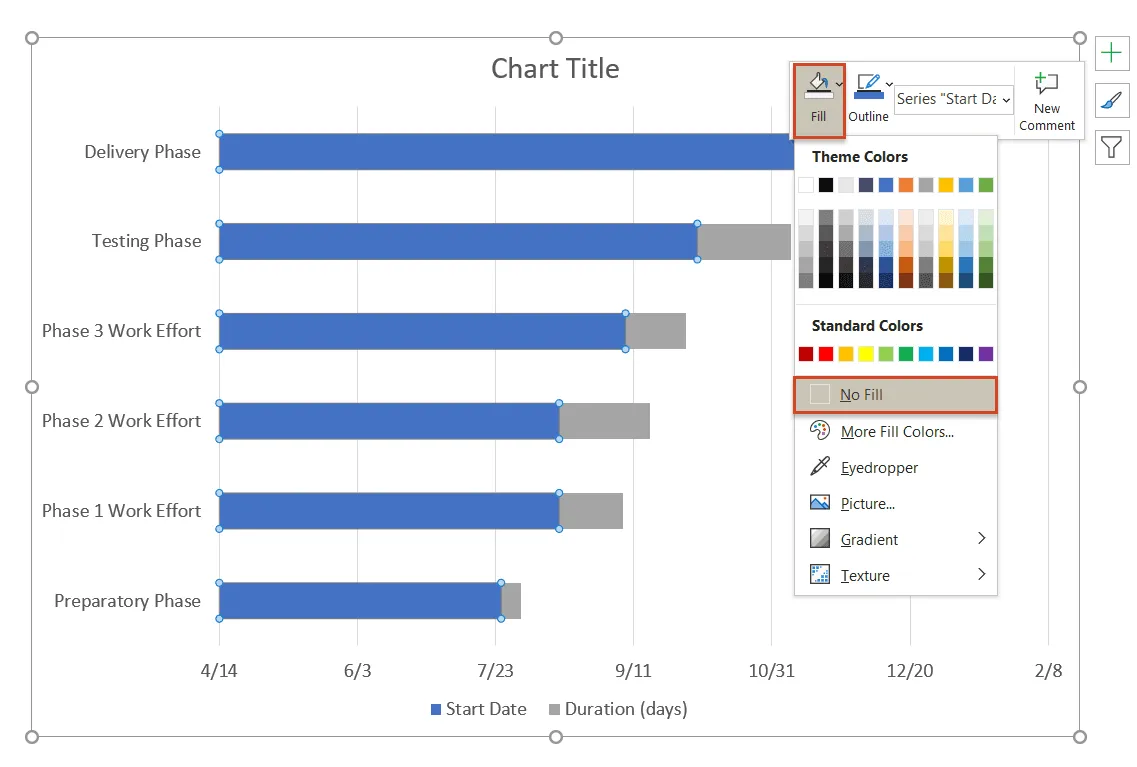
Step 3: Click the filter icon on the chart’s right side. Uncheck “End Date” and click “Apply”. Set the Duration bar to display as a progress bar.
Step 4: Right-click a blue bar on the chart to open the mini toolbar. Click “Fill” and select “No Fill”. This leaves only the progress color.
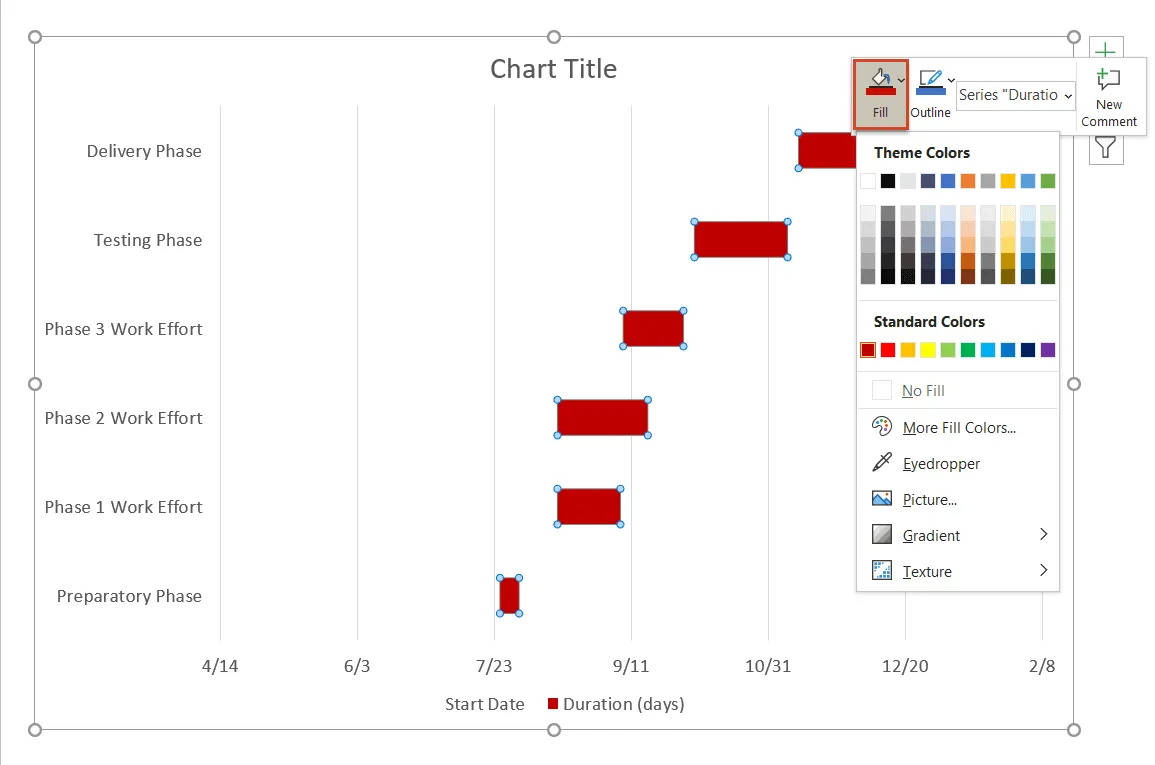
Step 5: The chart now displays as a Gantt chart. You can customize the existing progress bars by changing their fill color to your preference, enhancing the chart’s clarity and visual appeal.
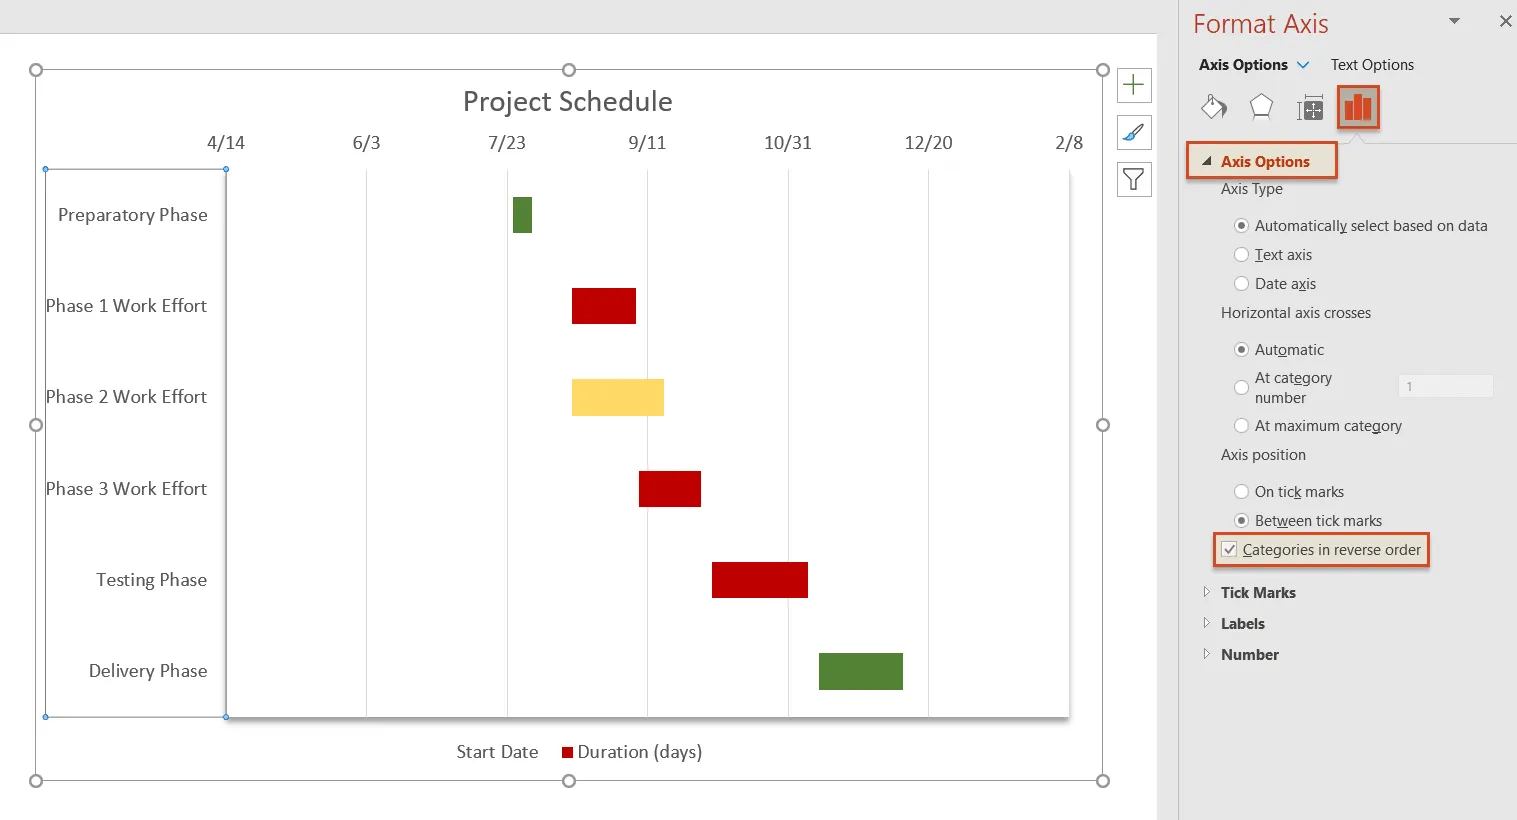
Step 6: Finally, open “Format Axis” and check “Categories in reverse order”. This reverses the Gantt chart sequence, placing the first task at the top.
You now have a fully functional Gantt chart.

Method 2: Building a Gantt Chart Using Tables and Shapes
The second method involves building a Gantt chart entirely manually using PowerPoint’s tables and shapes.
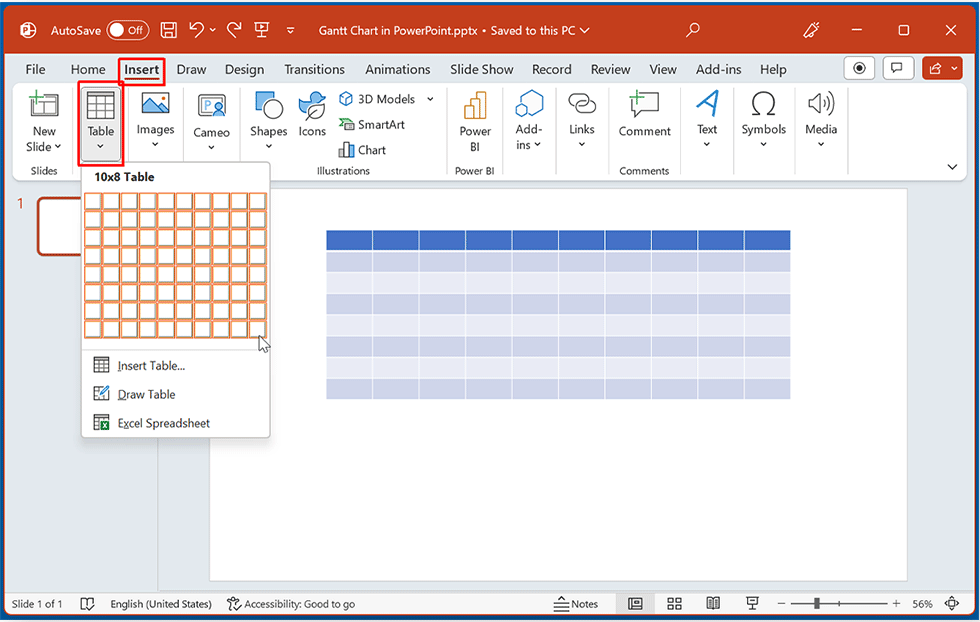
Step 1: In a new PowerPoint presentation, click “Insert” > “Table” in the top menu, select the number of rows and columns, and insert the table.
Step 2: Populate the table with your Gantt chart data, such as start time, end time, and activity progress.
Step 3: At the corresponding position in each row, click “Insert” > “Shapes” to insert a rectangle as the progress visualization shape. Adjust the rectangle’s length to match the task duration.
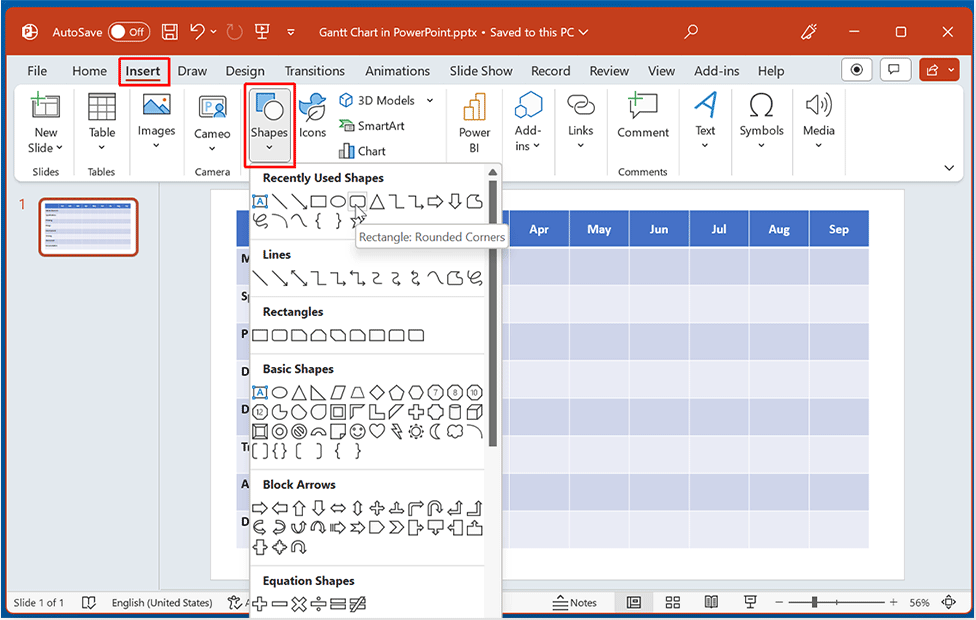
Step 4: Position the shapes within the table to fill in the progress for all tasks in the Gantt chart.
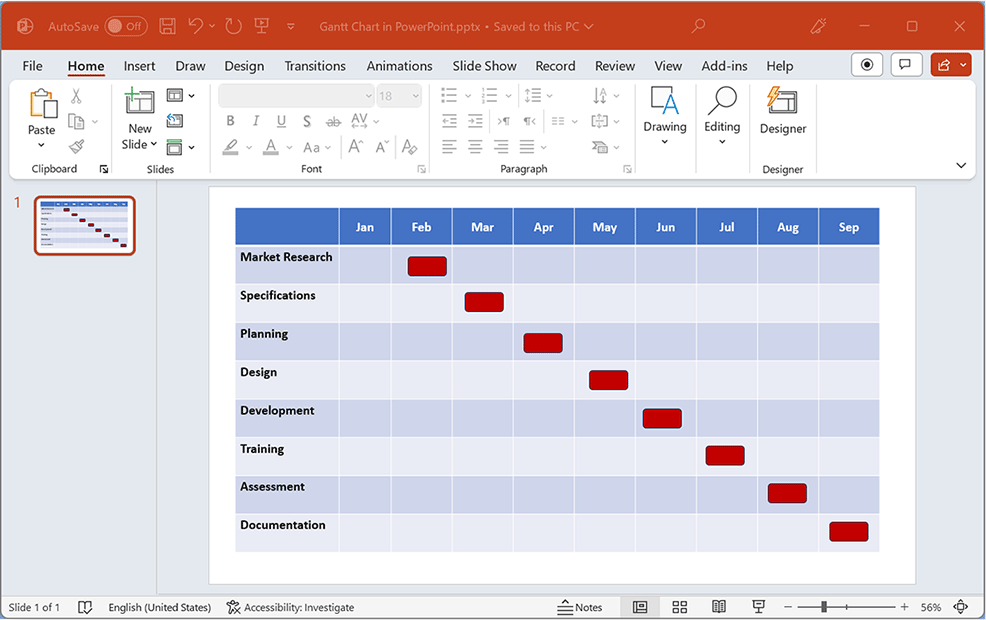
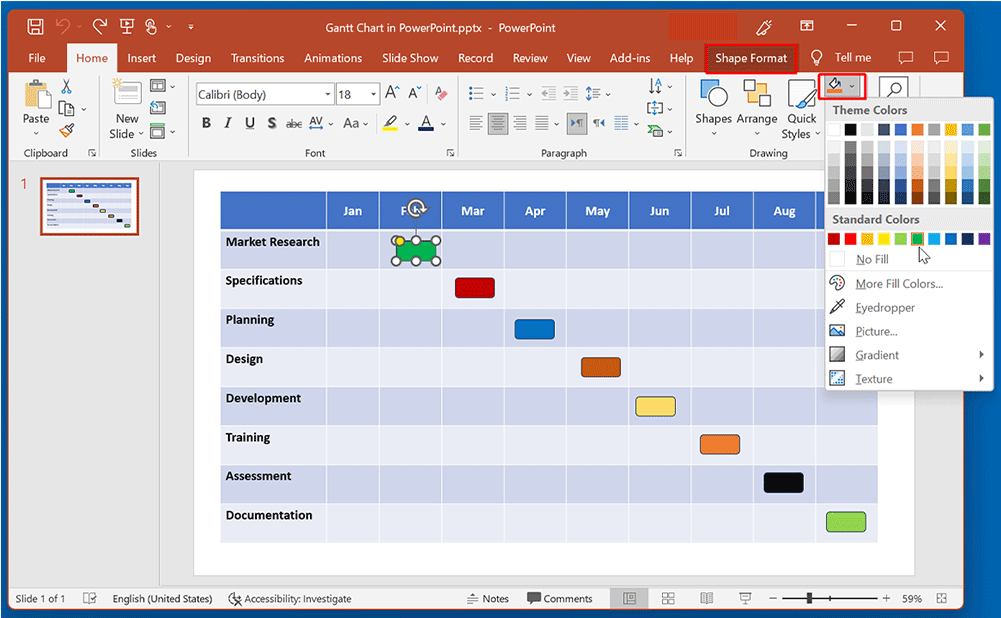
Step 5: Finally, adjust the shapes in “Shape Format”, assigning different colors and styles for various stages. This completes the entire Gantt chart creation effortlessly.
This method works well for static charts but is not ideal for projects requiring frequent updates.
Method 3: Making a Gantt Chart Using PowerPoint Templates
If you’re looking for a quick and visually appealing solution, PowerPoint’s Gantt chart templates are the most time-saving option.
Step 1: Click “File” > “New”, then search for “Gantt Chart” in the template library.
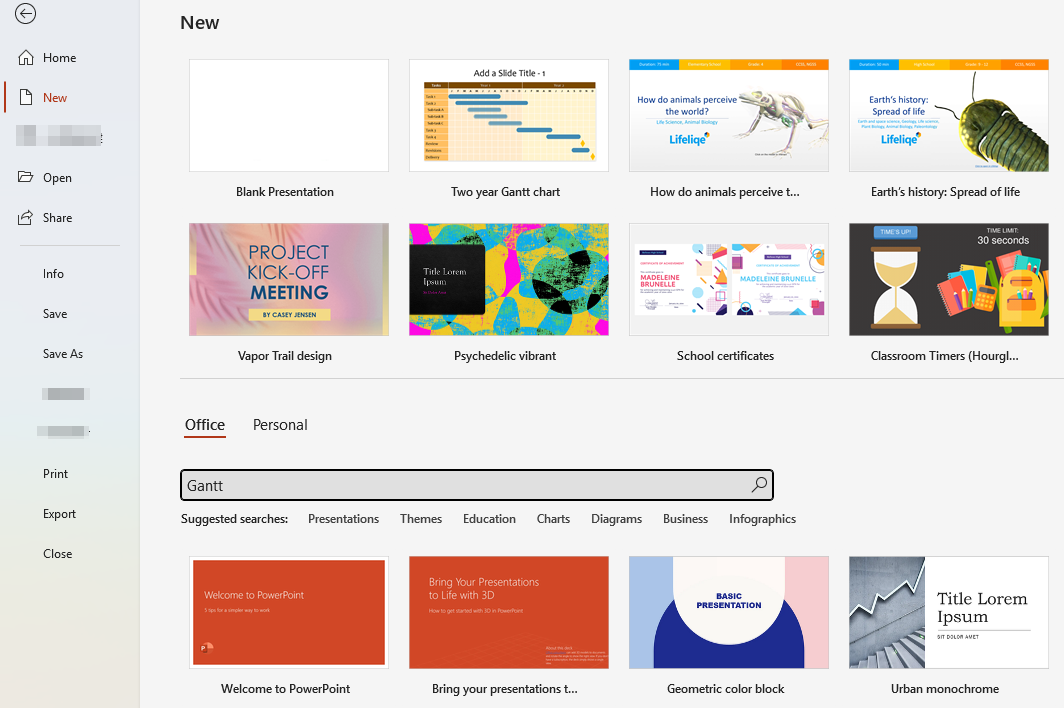
Step 2: Select the appropriate Gantt chart template file and click “Create” to apply it.
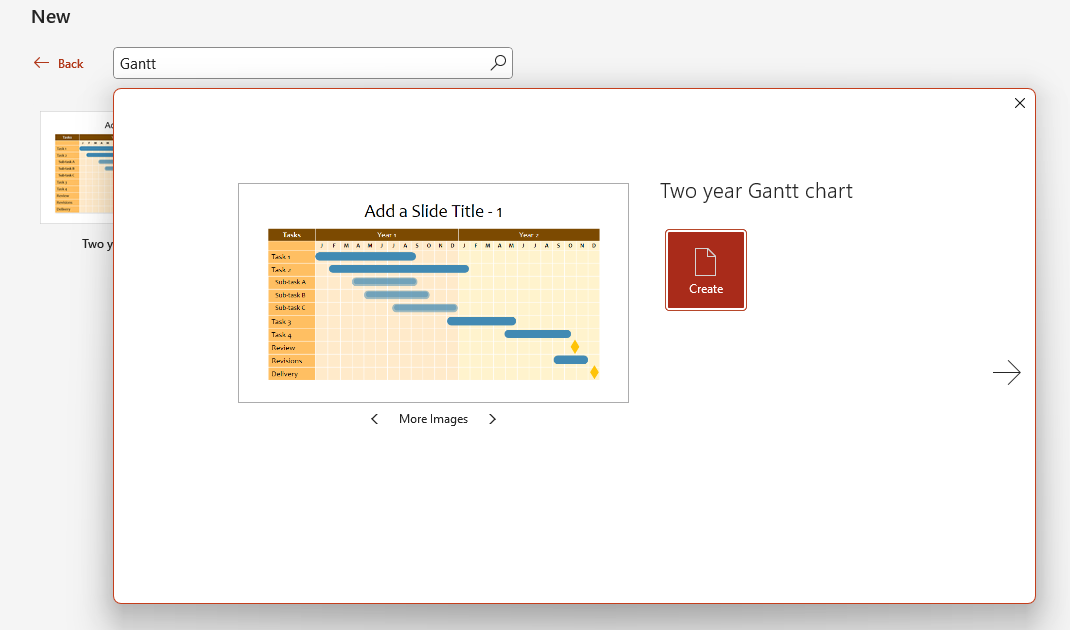
Step 3: Replace the sample data with your own information. Drag the bar to adjust task durations.
Step 4: After completing data modifications, customize the color scheme to match your presentation theme.
Templates are convenient, but if your tasks change often, updating them manually can get tedious. If you need to use gantt chart often, you can save slide as template.
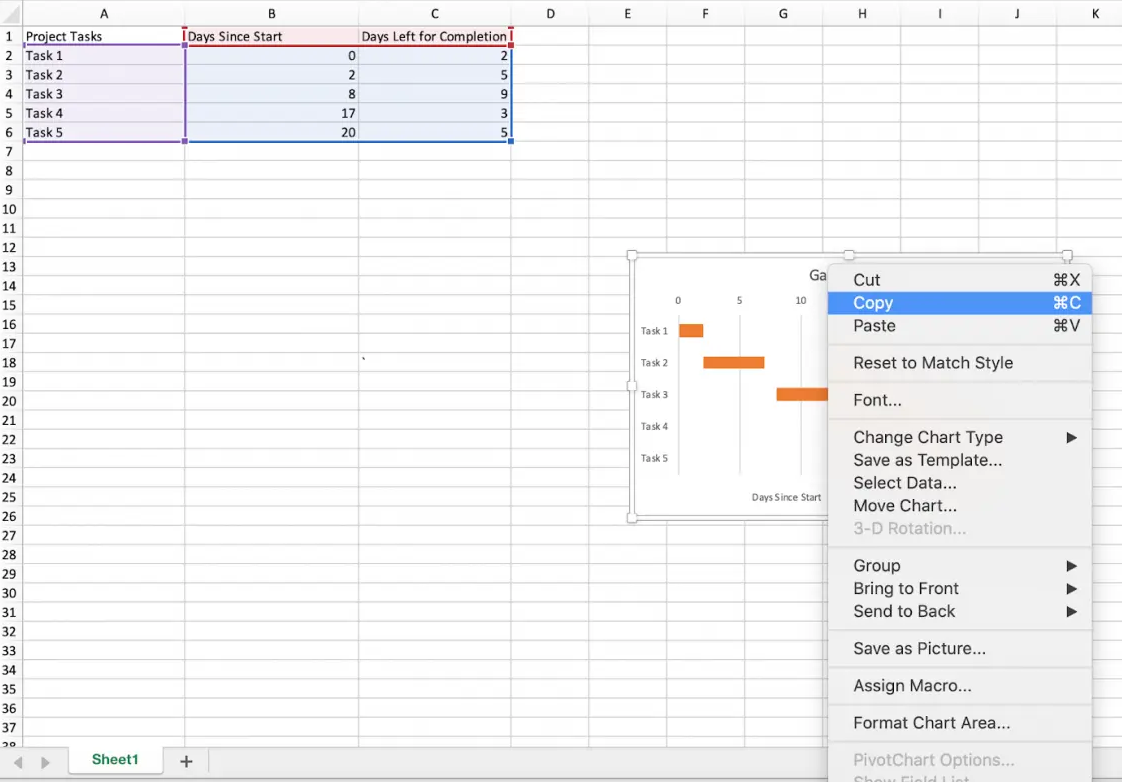
If your Gantt chart is already created in Excel, you can import it directly into PowerPoint.
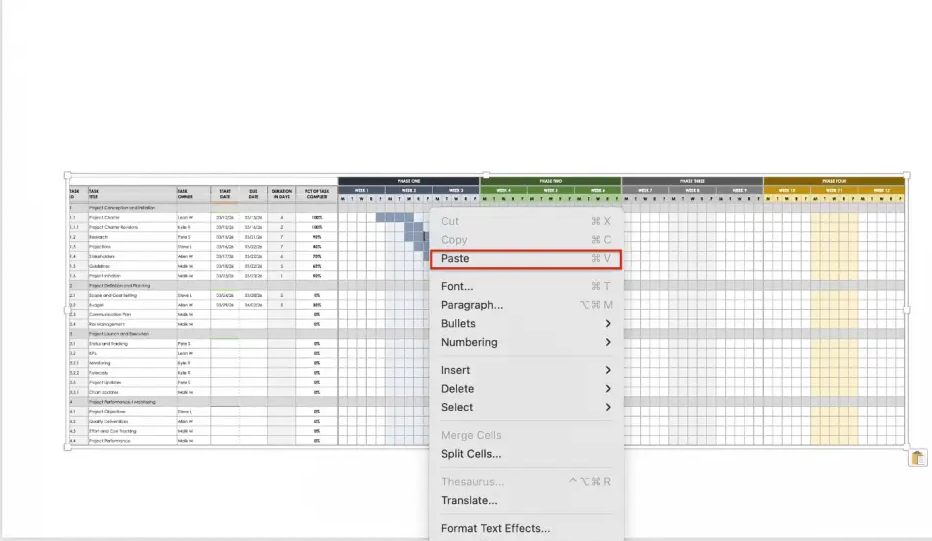
Step 1: Open the Gantt chart in Excel, select the entire chart, right-click, and choose “Copy”.
Step 2: Return to PowerPoint. On the slide, click “Embed” under the “Paste Options”.
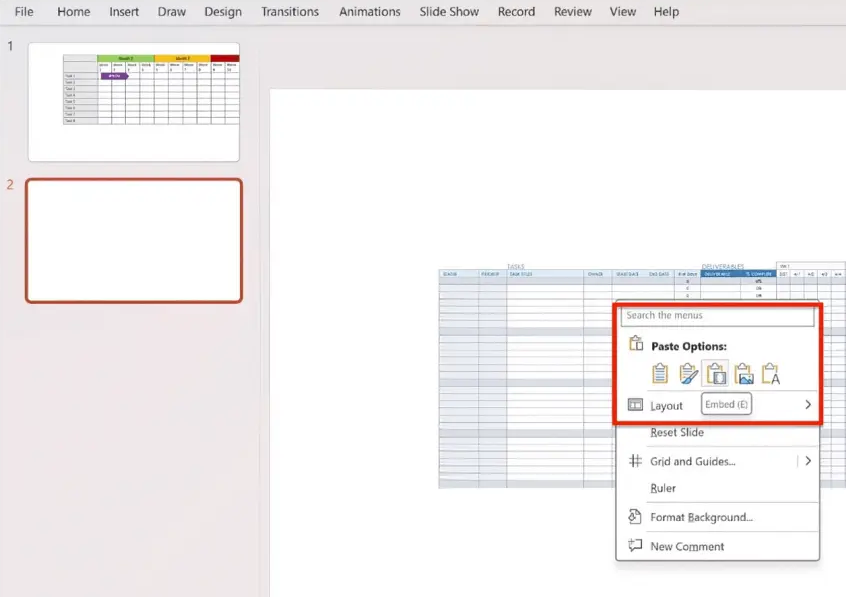
Your Excel Gantt chart will appear in PowerPoint. To update dates or tasks, just edit the chart in Excel, and the changes will automatically show up in your slides.
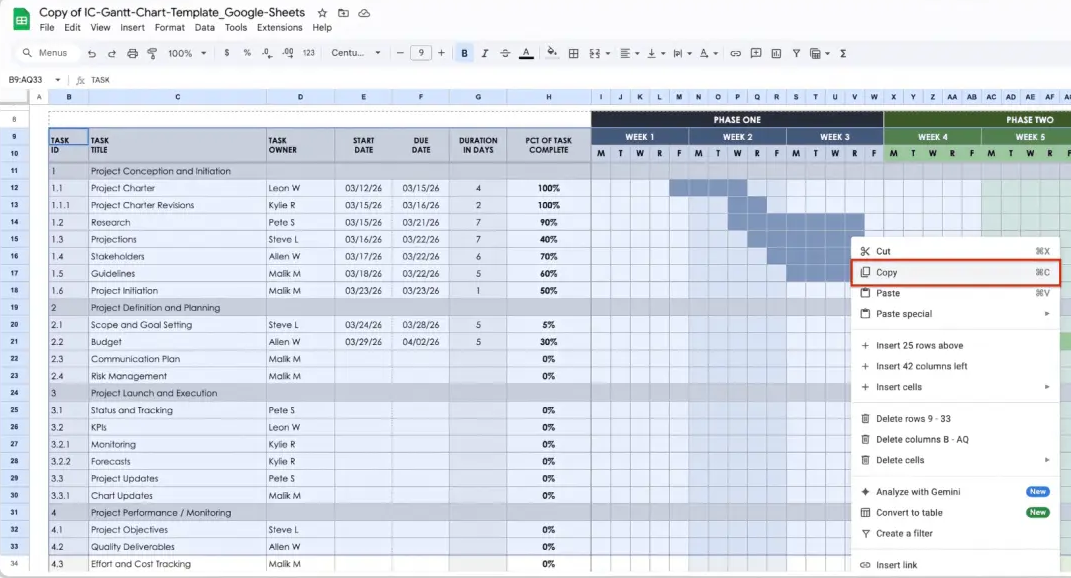
Step 1: Open the Gantt chart you created in Google Sheets.
Step 2: Click on the Gantt chart, then right-click and select “Copy”.
Step 3: Return to the PowerPoint, right-click, and select “Paste”.